SQL Data Queries
Published:
Introduction
In a previous project I demonstrated my ability to design and implement a relational database (DB). However, I want to create a project where I focus solely on my ability to write efficient and effective SQL queries from a relational database. The Db I will be using is one that encompasses all the data that I accumulated for my Ph.D. dissertation research. The creation and details behind the DB can be found following this link. The details around the data are not that important my goal here is to showcase my SQL technical abilities through data queries.
The relational DB is housed in a PostgreSQL data base and I am interfacing with it on a local server using the program DBeaver. Within this project I am going to go through 20 different prompts that I must accomplish by writing SQL code. The relative difficulty of the queries will increase throughout the document.
Database Archetecture
Before jumping into the SQL code, I want to briefly go through the design of this database, which is more thoroughly covered in the before mentioned project.
The database originates from my published database CDFLOW, which consists of dissolved CO2 estimates from flowing freshwaters across the US from 1990 through 2020. Additional tables related to spatial site data and add to the original data by including geographical reference data and additional environmental metrics. The layout of the relational DB can be seen in the below ER diagram, which also shows the primary and foreign keys for each table.

Round 1 Prompts 1-10
The first round of queries will on involve querying data from a single table.
0. (Preview prompt) Display a list of all the tables included in the DB.

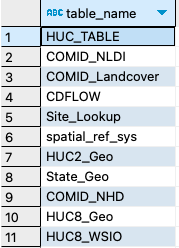
0.5. (Preview prompt) Display a list of all the columns in the CDFLOW table. (This table is the focus of most queries)

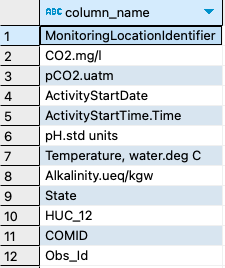
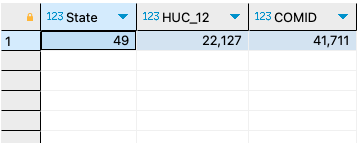
1. Of the three spatial grouping features how many unique groups are represented?

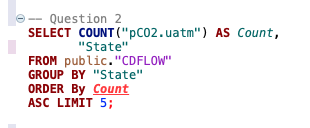
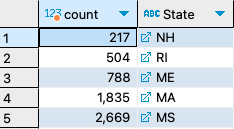
2. How many observations are available in each of the 49 states represented in the data? Which state has the least? (Washington D.C. is considered a state for this DB)
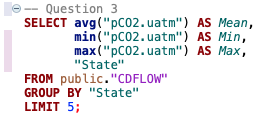
3. What is the mean, max, and min pCO2 value from each state?

4. How many observations have pH values over 7?


5. How many observations have above average pCO2 values?


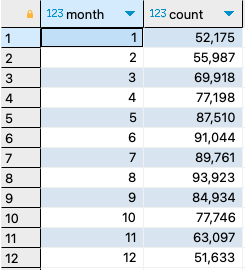
6. How many observations occur in each month?

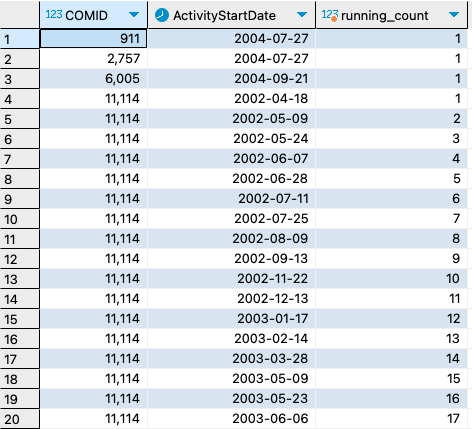
7. Compute a running count of observations by date in each COMID.

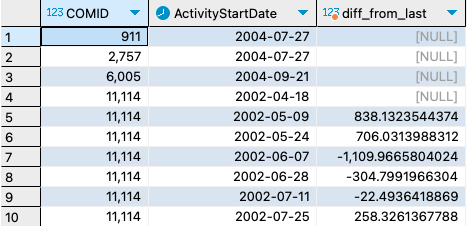
8. Write a query to look at the difference between the most recent pCO2 value from the last at a particular COMID.

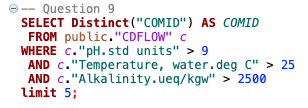
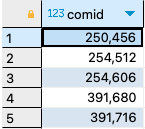
9. List COMIDS that have pCO2 values with pH > 9, Alkalinity < 2500, and temperature > 25?
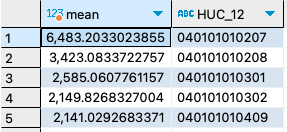
10. What are the average HUC_12 pH values in Minnesota?

Round 2 Prompts 11-15
The second round will involve more difficult queries which may include data from 2 or more tables.
11. Query pCO2 estimates with COMID_NHD table data.


12. Query pCO2 estimates where over 50% of the HUC8 is covered by water.
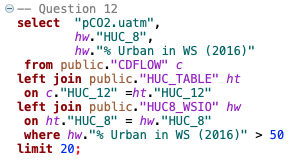
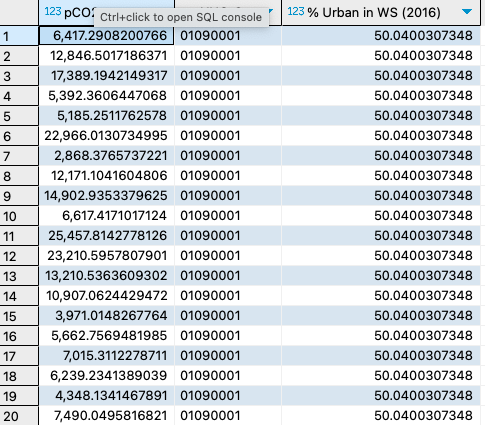
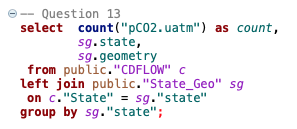
13. Query the Average pCO2 by state and join with the state spatial table so that geometry data is available.

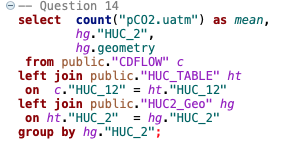
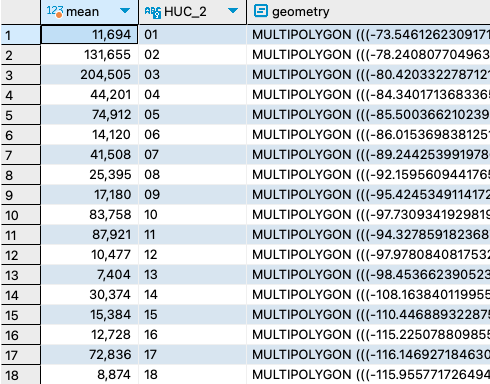
14. Similar to number 13, query the average pCO2 by HUC2 and join with the HUC2 spatial table so that geometry data is available.
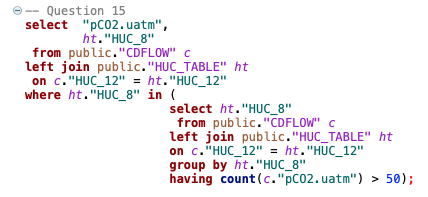
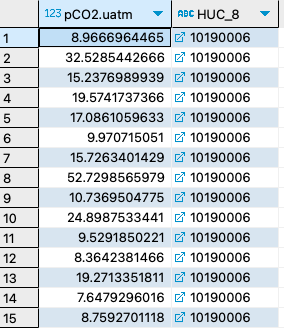
15. Query pCO2 estimates from HUC8s where at least 50 observations are available.
Round 3 Prompts 16-20
The third and final round will include more advanced data queries.
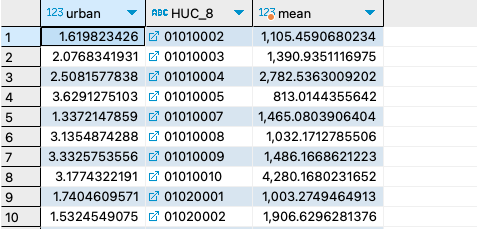
16. Query the average pCO2 and percent urban landcover by HUC8, only include complete observations.

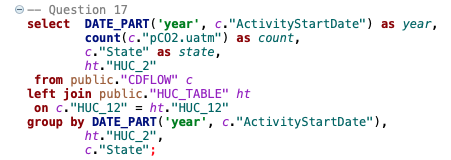
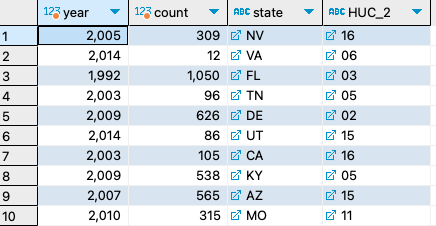
17. Query the counts of pCO2 data within each HUC2 for each state for every year available.
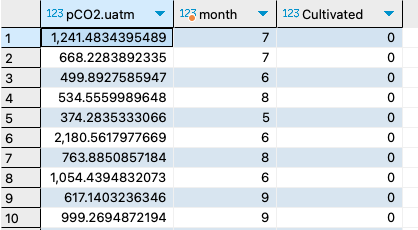
18. Query pCO2 estimates and percent cultivated land cover observations collected between the months of May and September. Additionally filter out observations where Alkalinity it not at least 1000.

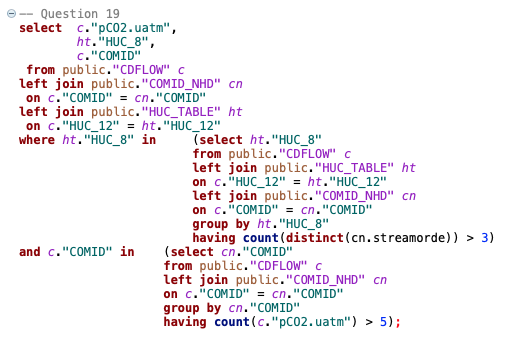
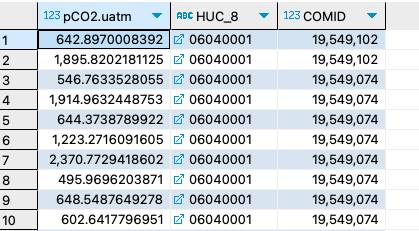
19. Query pCO2 estimates where within each HUC8 COMIDs represent at least three different streamorder levels and each comid has at least 5 observation.
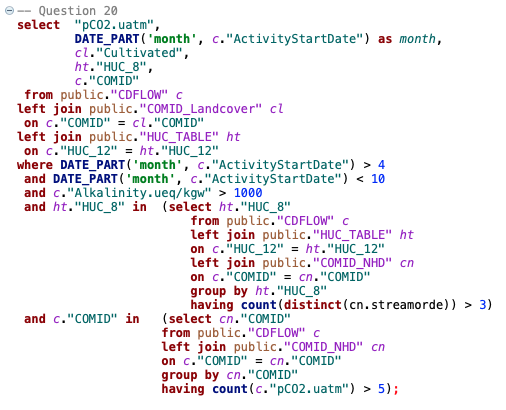
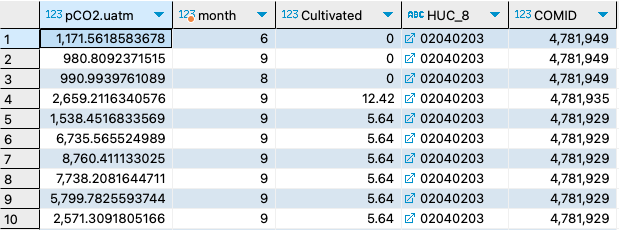
20. Combine prompts number 18 and 19. (This is actually data I am interested in modeling for research)
Conclusion
SQL is great for querying big and complex relational databases. Although, there may be a bit of a learning curve to writing complex queries, once learned Data Scientists’ can cut through big data in no time at all.
Thanks for reading and I hope this showcases the SQL technical skill that I possess! Hopefully you even picked up a new skill or two.