New York City Real Estate
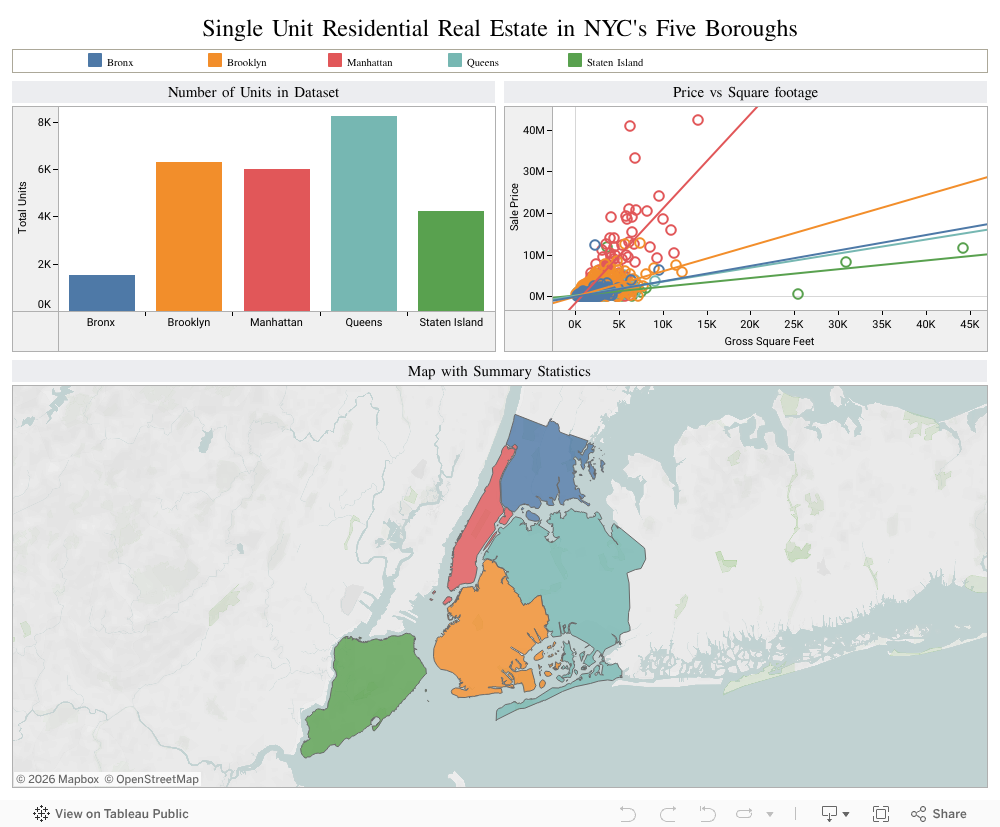
This dashboard was created using the NYC Property Sales dataset from Kaggle. The data includes real estate transactions across NYC's five boroughs. I have filtered the dataset down to only include the sale on single unit residential sales at fair market. Additionally, I joined the real estate dataset with spatial data from the city of New York to include spatial visualizations. Click on any one of the boroughs to focus in on it across the dashboard.Supermarket Sales Data
This dashboard was created using the Supermarket sales dataset from Kaggle. The dataset includes sales data at a supermarket chain with three branches. Also, included is customer rating data from each transaction. You can switch between a sales-focused view and a customer ratings-focused view using the button on the left-hand side. Check out the filter in the top right-hand corner to change the view from all stores to any combination of the three.CDFLOW
This dashboard was created using a database that is a part of my Ph.D. dissertation work. It includes estimated dissolved CO2 data from flowing freshwaters across the US from 1990 through 2020. This interactive data visualization is intended to show viewers where and when data is represented in the database across the US. For more information on the creation of the database please see the accompanied published data paper and to access CDFLOW follow the Figshare link.